Many of us are attracted to Power Apps for the speed and simplicity in which we can create feature-rich applications that can draw from many data sources and interact with a variety of systems.
However, despite its many improvements over the past few years, Power Apps still lacks some of the options available in web technologies, such as CSS. As such, to achieve similar functionality, the app maker needs to implement some of these changes manually. In this article, I want to discuss how you can easily create galleries that have alternate coloured (or banded) rows.
Row Identifier
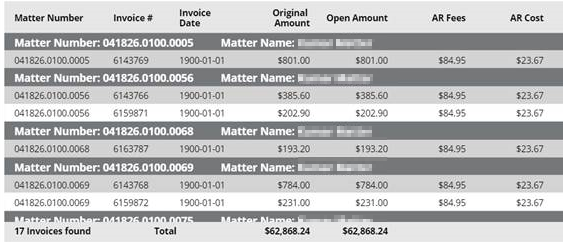
The first step we need to do is add some metadata to each field that will allow us to determine which of the two colours should apply to it. You could add a boolean value of true or false or an integer, such as 0 or 1. In my example above, I’m using an automatically-generated row number as described in this article. I am collecting the data from a SharePoint list, On-Site Client Access, into my bandItems collection. You can see the code segment below that helps add the RowIndex for each item in the bandItems collection.
ClearCollect(collItems, 'On-Site Client Access');
Clear(bandItems);
ForAll(collItems,
       Collect(bandItems,
               Last(FirstN(AddColumns(collItems,
                                "RowIndex",
                                CountRows(bandItems)+1
                           ),
                           CountRows(bandItems)+1
                    )
               )
       )
)
Setting Row colours
The Power Apps gallery has property, TemplateFill, that is used to set the background of each row in the gallery. (note: if you have a vertical gallery, then the rows become columns). Normally, you may want to give it a certain colour to match with the rest of the app. For banding though, you will leverage the metadata field to set the TemplateFill. In my case, I want the bands to alternate between white and gray (as shown above in the image). To achieve this, I set the TemplateFill colour to dRGBA(0,0,0,Mod(ThisItem.RowIndex,2)/2)
In other words, when the remainder of the RowIndex/2, then set the alpha channel (opacity) to 0%, hence making the background white. This happens for all rows, where the RowIndex is an even number. If it is odd, then the remainder will always be 1, and the opacity will be 50%.
Going beyond simple bands
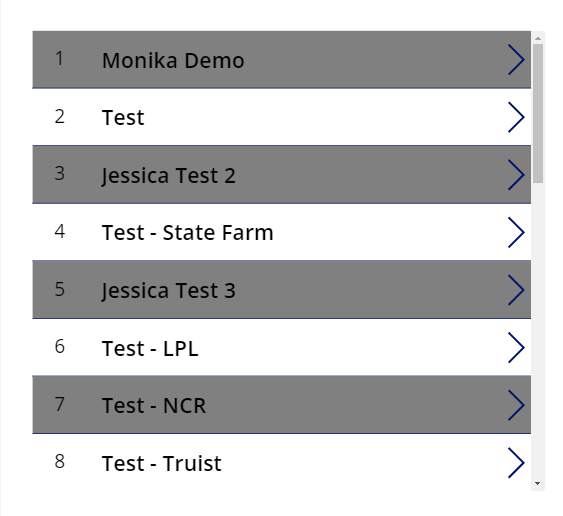
Using this same approach, you can add additional metadata fields that could allow you to create a rich visual experience with grouping and other visualization, such as hiding some fields for certain conditions, as shown below.